Ways to Represent Domain and Range
In this lesson, you will learn
- the 4 ways to represent a relation: ordered pairs, a mapping diagram, a table and a graph
- how to read the domain (x-values) and the range (y-values) from each one
- how to order the values and why a repeated value is written only once
The 4 Ways to Represent Domain and Range
There are 4 different ways to represent domain and range. These are ordered pairs, a mapping diagram, a table, and a graph.
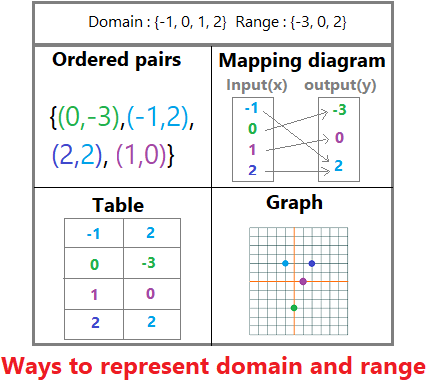
The domain is the set of x-values (the inputs). The range is the set of y-values (the outputs). In the ordered pair (−1, 2), −1 is in the domain and 2 is in the range.
What are the domain and the range of { (3, 1), (−2, 4), (0, 1) }?
Show answer
Domain: { −2, 0, 3 }. Range: { 1, 4 }. The 1 appears twice as an output but is written only once.
Important Observations About the Different Ways to Represent Domain and Range
- In a table, put the x-values in increasing order or from least to greatest.
- In a mapping diagram, put both the x-values and the y-values in increasing order. Furthermore, do not repeat a number! For example, notice that 2 is listed as an output only once.
- When representing the domain and range as ordered pairs, there is no need to write the pairs in order.
- When writing the domain and the range, always list in numerical order.
- Finally, notice that we put the x-values in the domain on the left of the table and also on the left of the mapping diagram.
Writing a repeated value twice in the range. In the figure, (−1, 2) and (2, 2) both have the output 2, but the range is { −3, 0, 2 }, not { 2, −3, 0, 2 }.
- Put the x-values on the left, from least to greatest: −3, 1, 4.
- Write each y-value next to its x-value: −3 → 5, 1 → −1, 4 → −1.
- Domain: the x-values in numerical order, { −3, 1, 4 }.
- Range: the y-values in numerical order, each written once, { −1, 5 }.
| x | y |
|---|---|
| −3 | 5 |
| 1 | −1 |
| 4 | −1 |
Domain { −3, 1, 4 }, range { −1, 5 }
A mapping diagram has the outputs 7, 7 and 3. How should the right oval list them?
Show answer
3, 7. Put the outputs in increasing order and write 7 only once.
Summary
- A relation can be shown as ordered pairs, a mapping diagram, a table or a graph.
- The domain is the set of x-values; the range is the set of y-values.
- Write the domain and the range in numerical order, and write each number only once.
- In a table and in a mapping diagram, the x-values go on the left, in increasing order.
- Ordered pairs don't need to be written in order.
Test Yourself: Interactive 10-Question Quiz
Now check what you learned. Every answer is explained, and each time you play you get new questions.
Quiz Complete! 🎉