Graph of the Absolute Value of x
Graph of the Absolute Value of x
The graph of the absolute value of x is called the parent absolute value function. The reason it is given this name is because the absolute value of x is the simplest of all absolute value functions, and every other absolute value function is a transformation of it.
In this lesson, you will learn
- How to find the vertex of an absolute value function
- How to graph f(x) = |x| using the vertex and a few points
- The slope, symmetry, domain and range of the graph
The General Form and the Vertex
The general form of an absolute value function is
The vertex of the graph is
Using f(x) = |x| we see that m = 1, b = 0, and c = 0.
Getting the sign of the vertex wrong. In f(x) = |x − 4|, b = −4, so the x-coordinate of the vertex is −(−4) ÷ 1 = 4, not −4. The vertex is (4, 0).
What is the vertex of f(x) = |2x − 6| + 1?
Show answer
(3, 1). Here m = 2, b = −6 and c = 1, so −b ÷ m = 6 ÷ 2 = 3, and the vertex is (3, 1).
How to Graph the Absolute Value of x
You can graph the absolute value of x by looking for the vertex and several other selected points.
- First, find the vertex. The vertex is located at (−b / m, c). Therefore, the vertex is (−0 / 1, 0) or (0, 0).
- Now, evaluate the function for several selected values of x:
- f(1) = |1| = 1. The point is (1, 1).
- f(−1) = |−1| = 1. The point is (−1, 1).
- f(2) = |2| = 2. The point is (2, 2).
- f(−2) = |−2| = 2. The point is (−2, 2).
- f(3) = |3| = 3. The point is (3, 3).
- f(−3) = |−3| = 3. The point is (−3, 3).
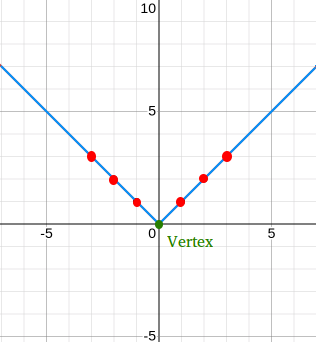
- Now, graph the following 7 points: (0, 0), (1, 1), (−1, 1), (2, 2), (−2, 2), (3, 3), and (−3, 3), and draw a straight line through the points on each side of the vertex.
The graph is a V shape with its vertex at (0, 0).
What point on the graph of f(x) = |x| has an x-coordinate of −5?
Show answer
(−5, 5). f(−5) = |−5| = 5.
Things to Notice About the Graph of the Absolute Value of x
- The angle at the vertex is a right angle.
- The graph is symmetric about the y-axis.
- The linear "piece" on the right side of the y-axis has a slope of 1 and the linear "piece" on the left side of the y-axis has a slope of −1.
- The graph is located on both sides of the y-axis, so the domain is all real numbers or (−∞, ∞).
- The graph is located above the x-axis with the exception of the point (0, 0), so the range is all non-negative real numbers or [0, ∞).
|x| is never negative, so no part of the graph is below the x-axis. The lowest point of the graph is the vertex.
Why is the angle at the vertex a right angle?
Show answer
Because the two pieces have slopes 1 and −1. Each piece makes a 45° angle with the x-axis, and 45° + 45° = 90°.
Summary
- f(x) = |x| is the parent absolute value function.
- The general form is f(x) = |mx + b| + c, and the vertex is (−b / m, c).
- For f(x) = |x|, the vertex is (0, 0).
- To graph it, plot the vertex and a few points on each side, such as (1, 1) and (−1, 1).
- The graph is a V shape, symmetric about the y-axis, with slopes 1 and −1.
- The domain is (−∞, ∞) and the range is [0, ∞).
Test Yourself: 10-Question Quiz
Now check what you learned. Every answer is explained, and each time you play you get new questions.
Quiz complete!