Types of Statistics: Descriptive and Inferential
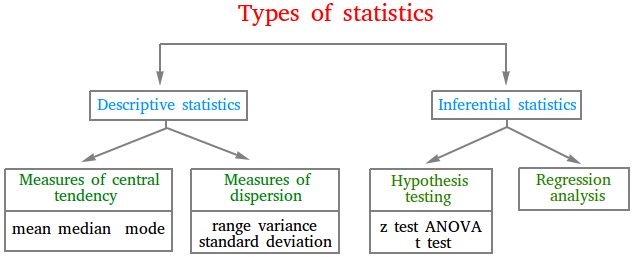
In applied statistics, the types of statistics can be divided into two areas: descriptive statistics and inferential statistics.
In this lesson, you will learn
- what descriptive statistics is and which tools it uses
- what inferential statistics is and how it uses a sample to draw conclusions about a population
- how to tell the two types of statistics apart
What Is Descriptive Statistics?
Suppose you collect information on the number of students who graduate from high school before the age of 18 state by state in the United States. You will end up with lots of data.
Just having such a huge and unorganized amount of data is insignificant unless you can use it to draw conclusions or make important decisions.
The best way to create something useful and manageable with the data is to create tables, diagrams, or graphs that summarize the data. Once you have those tables, graphs, or diagrams that describe the data, it will be much easier to draw conclusions.
In descriptive statistics, you will also use the data to find measures of central tendency such as the average, the mode, or the median and measures of dispersion such as the range or the standard deviation. This is what descriptive statistics is about.
Descriptive statistics consists of methods that are used to organize and display data into a manageable size with tables, graphs, and/or measures of central tendency and dispersion.
- Organize: in order, the scores are 8, 8, 8, 10, 12, 15, 15, 20.
- Mean: 8 + 8 + 8 + 10 + 12 + 15 + 15 + 20 = 96, and 96 ÷ 8 = 12.
- Median: the two middle values are 10 and 12, so the median is (10 + 12) ÷ 2 = 11.
- Mode: 8 appears most often (3 times).
- Range: 20 − 8 = 12.
The mean is 12 points, the median is 11 points, the mode is 8 points and the range is 12 points. These numbers describe this one game and these 8 players, so this is descriptive statistics.
A teacher makes a bar graph of her students’ test grades and finds the median grade. Which type of statistics is she using?
Show answer
Descriptive statistics. A graph and the median organize and describe the data she has. She does not draw a conclusion about any other students.
What Is Inferential Statistics?
Suppose you want to find the salary of people who are at least 45 years old living in the United States. To do this, you may select people from all 50 states who are at least 45 years old and find their salaries.
The information will be summarized of course with a graph or a table.
If you are now younger than 45 years old and you are curious about your salary in the future, you can then analyze the graph and make an inference or educated guess. The graph may tell you what your salary may be like when you reach 45.
You cannot ask every person in the United States who is at least 45. The people you select are a sample. Inferential statistics uses what you learn from the sample to draw conclusions about the whole population: all people in the United States who are at least 45.
Hypothesis testing such as z test, t test, or ANOVA test can also be implemented in order to make an inference or test assumptions. Linear regression can also be used to model the data and then make predictions.
Inferential statistics consists of using the data that is collected from a sample in order to make inferences about a population and speculate on the future by using graphs, hypothesis testing, and linear regression. Inferential statistics can also be called inductive statistics.
- The population is all 5,000 bulbs. The sample is the 50 tested bulbs.
- In the sample, 2 out of 50 bulbs are faulty: 2 ÷ 50 = 0.04, or 4%.
- Use the sample to make an inference about the population: 4% of 5,000 = 0.04 × 5,000 = 200.
About 200 of the 5,000 bulbs are probably faulty. This is an inference, so it is an estimate, not an exact count.
Treating a result from a sample as exact. Another sample of 50 bulbs might have 1 or 3 faulty bulbs, which would give a different estimate. That is why a sample must be chosen with care, so that it is a representative sample of the population.
A newspaper asks 800 voters which candidate they prefer and uses the answers to predict who will win the election. Which type of statistics is this?
Show answer
Inferential statistics. The 800 voters are a sample, and the newspaper uses them to draw a conclusion about all voters.
Descriptive vs Inferential Statistics: Side by Side
To decide which type of statistics you are using, ask one question: am I only describing the data I have, or am I using it to draw a conclusion about a larger group or about the future?
| Descriptive statistics | Inferential statistics | |
|---|---|---|
| Goal | Organize and describe the data you have | Draw conclusions or make predictions beyond the data |
| Data | A sample or a whole population | A sample, used to learn about a population |
| Tools | Tables, graphs, mean, median, mode, range, standard deviation | Hypothesis testing (z test, t test, ANOVA), linear regression |
| Result | Exact facts about the data, such as “the mean is 12 points” | An estimate or a prediction, such as “about 200 bulbs are faulty” |
The two types work together. In the salary example, the graph of the salaries is descriptive statistics. Using that graph to guess your own salary at 45 is inferential statistics.
A store finds the mean of its own sales for each day last month. Is that descriptive or inferential? What if the store uses those sales to predict next month’s sales?
Show answer
The mean of last month’s sales is descriptive; the prediction for next month is inferential. The first only describes data the store has. The second uses the data to say something about the future.
Interactive Practice: Descriptive or Inferential?
Read each statement and choose the type of statistics. Every answer is explained. Click “New statements” to get a new set.
Summary
- In applied statistics, there are two types of statistics: descriptive statistics and inferential statistics.
- Descriptive statistics organizes and displays data with tables, graphs, and measures of central tendency (mean, median, mode) and dispersion (range, standard deviation).
- Inferential statistics uses data from a sample to make inferences about a population and predictions about the future, with tools such as hypothesis testing and linear regression.
- Inferential statistics is also called inductive statistics. Its results are estimates, so the sample must be chosen with care.
- To tell them apart, ask: am I only describing my data, or drawing a conclusion beyond it?
Test Yourself: Interactive 10-Question Quiz
Now check what you learned. Every answer is explained, and each time you play you get new questions.
Quiz complete!