Mean from a Frequency Table
You can find the mean from a frequency table when you don't know the exact values in the classes.
In this lesson, you will learn
- why you use the class midpoint for every value in a class
- the formula for the mean from a frequency table: = Σ f × x ÷ Σ f
- how to find the mean step by step, and why the answer is an estimate
Use the Class Midpoint for the Values in Each Class
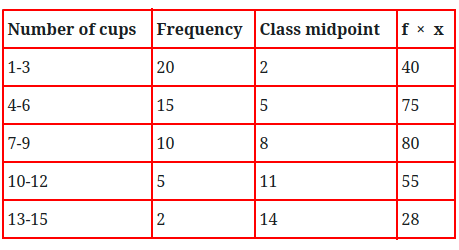
Suppose somebody conducted a survey to find out the number of cups of water drunk daily by people. The person who conducted the survey interviewed 52 people and he gave you this frequency table in order to find the mean.
Since you don't know the values in the classes, you can pretend that each value in a class is estimated by the class midpoint.
For example, the possible values in the class 4–6 are 4, 5, and 6.
Since you have no idea how many times 4, 5, or 6 occurs in that class, you will just use the class midpoint or 5.
Class midpoint = (lower class limit + upper class limit) ÷ 2. For the class 4–6, the midpoint is (4 + 6) ÷ 2 = 5.
Notice that the frequency of this class is 15. This means that the "pretend" raw data for each class is:
Class 4–6 (15 values)
5 5 5 5 5
5 5 5 5 5
5 5 5 5 5
Class 1–3 (20 values)
2 2 2 2 2 2 2 2 2 2
2 2 2 2 2 2 2 2 2 2
Class 7–9 (10 values)
8 8 8 8 8
8 8 8 8 8
Class 10–12 (5 values)
11 11 11 11 11
Class 13–15 (2 values)
14 14
There are 52 numbers from these 5 classes.
To find the mean, you need to add these 52 numbers and divide by 52.
Instead of adding 52 numbers together, there is an easier way. You could do:
The math above is found by multiplying the frequency and the class midpoint and then adding the products.
What is the class midpoint of the class 20–29?
Show answer
24.5. (20 + 29) ÷ 2 = 49 ÷ 2 = 24.5. A midpoint does not have to be a whole number.
Formula to Use to Get the Mean from a Frequency Table
If f represents the frequencies and x represents the midpoints, the math can be expressed as Σ f × x.
To get 52, you need to add the frequencies together. This can be expressed as Σ f.
To get the mean from a frequency table, use the formula below:
Using our table above, we can compute the mean as shown below:
Mean = 15 × 5 + 20 × 2 + 10 × 8 + 5 × 11 + 2 × 1452
Mean = 75 + 40 + 80 + 55 + 2852
Mean = 27852
Mean ≈ 5.35
Therefore, we can conclude that people drink an average of about 5.35 cups of water daily.
This mean is an estimate. The real values in each class may be a little above or below the class midpoint, so the real mean may be a little different. 278 ÷ 52 = 5.346…, which rounds to 5.35.
Dividing by the number of classes instead of by Σ f. Here there are 5 classes, but 52 people. 278 ÷ 5 = 55.6 cups a day is impossible, because no class goes above 15 cups. Always divide by the sum of the frequencies.
Another Example: Hours of TV per Week
| Hours | Frequency (f) | Midpoint (x) | f × x |
|---|---|---|---|
| 0–4 | 6 | 2 | 12 |
| 5–9 | 9 | 7 | 63 |
| 10–14 | 4 | 12 | 48 |
| 15–19 | 1 | 17 | 17 |
| Total | Σ f = 20 | Σ f × x = 140 |
- Find each class midpoint: (0 + 4) ÷ 2 = 2, (5 + 9) ÷ 2 = 7, (10 + 14) ÷ 2 = 12 and (15 + 19) ÷ 2 = 17.
- Multiply each frequency by its midpoint: 6 × 2 = 12, 9 × 7 = 63, 4 × 12 = 48 and 1 × 17 = 17.
- Add the products: Σ f × x = 12 + 63 + 48 + 17 = 140. Add the frequencies: Σ f = 6 + 9 + 4 + 1 = 20.
- Divide: = 14020 = 7.
The students watch about 7 hours of TV per week on average.
A table has the classes 1–3 (frequency 4) and 4–6 (frequency 6). Find the mean.
Show answer
3.8. The midpoints are 2 and 5. Σ f × x = 4 × 2 + 6 × 5 = 8 + 30 = 38, and Σ f = 4 + 6 = 10, so the mean is 38 ÷ 10 = 3.8.
Interactive: Find the Mean of Any Frequency Table
Change any class or frequency, add or remove classes, or load an example. The midpoints, the products f × x, the totals and the mean update right away, and the bar graph shows where the mean is.
| Class | Frequency (f) | Midpoint (x) | f × x | Remove |
|---|---|---|---|---|
| Total | Σ f = | Σ f × x = |
Summary
- When you don't know the exact values in the classes, use each class midpoint for every value in that class.
- Class midpoint = (lower class limit + upper class limit) ÷ 2.
- Multiply each frequency by its class midpoint and add the products to get Σ f × x. Add the frequencies to get Σ f.
- The mean is = Σ f × x ÷ Σ f. For the cups of water, 278 ÷ 52 ≈ 5.35 cups.
- Divide by Σ f, not by the number of classes. The result is an estimate of the mean.
Test Yourself: Interactive 10-Question Quiz
Now check what you learned. Every answer is explained, and each time you play you get new questions.
Quiz complete!