3 Circle Venn Diagram
A 3 circle Venn diagram, named after the English logician John Venn, is a diagram that shows how the elements of three sets are related using three overlapping circles.
When the three circles in a Venn diagram overlap, the overlapping parts contain elements that are common to any two circles or all the three circles.
In this lesson, you will learn
- What each part of a 3 circle Venn diagram means
- The difference between "A and B" and "A and B only"
- How to put the elements of three sets into a Venn diagram
How to Understand the Overlaps in a 3 Circle Venn Diagram
Let’s consider three sets A, B, and C and their corresponding circles:
- Set A: Students who play ping pong.
- Set B: Students who play soccer.
- Set C: Students who play basketball.
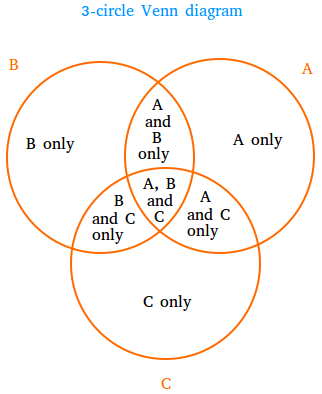
Non-Overlapping Sections
These represent elements that are unique to just one set. For example, students who only play ping pong would fall into the non-overlapping part of circle A.
Two-Circle Overlaps
These represent elements that are common to two sets but not the third set. For example, the overlap between circles A and B would represent students who play both ping pong and soccer but not basketball.
Three-Circle Overlap
These represent elements common to all three sets. In our example, this would be students who play ping pong, soccer, and basketball.
Some important observations:
- Elements in A and B = elements in A and B only plus elements in A, B, and C.
- Elements in B and C = elements in B and C only plus elements in A, B, and C.
- Elements in A and C = elements in A and C only plus elements in A, B, and C.
Forgetting the middle when counting a two-circle overlap. If 3 students play ping pong and soccer only, and 2 students play all three sports, then 3 + 2 = 5 students play both ping pong and soccer, not 3.
A student plays soccer and basketball but not ping pong. Which part of the diagram is this student in?
Show answer
B and C only. The student is in circle B and circle C but not in circle A, so the student goes in the overlap of B and C, outside A.
Example Showing How to Create a 3 Circle Venn Diagram
We can create a 3-circle Venn diagram to show the relationships between the factors of 30, 40, and 100.
- Factors of 30: 1, 2, 3, 5, 6, 10, 15, 30
- Factors of 40: 1, 2, 4, 5, 8, 10, 20, 40
- Factors of 100: 1, 2, 4, 5, 10, 20, 25, 50, 100
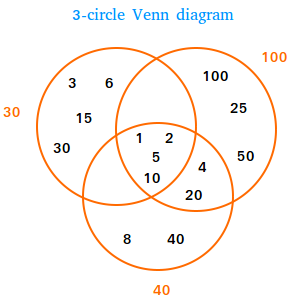
Non-Overlapping Sections
- Factors of 30: 3, 6, 15, 30
- Factors of 40: 8, 40
- Factors of 100: 25, 50, 100
Two-Circle Overlaps
- Factors of 30 ∩ Factors of 40 only: { }
- Factors of 30 ∩ Factors of 100 only: { }
- Factors of 40 ∩ Factors of 100 only: {4, 20}
Three-Circle Overlaps
- Factors of 30 ∩ Factors of 40 ∩ Factors of 100: {1, 2, 5, 10}
In the factors diagram, why is 20 in the overlap of the 40 and 100 circles only?
Show answer
20 is a factor of 40 and 100, but not of 30. 40 ÷ 20 = 2 and 100 ÷ 20 = 5, but 30 ÷ 20 is not a whole number.
How to Fill In a 3 Circle Venn Diagram
Start in the middle and work outward. Each element goes in exactly one part of the diagram.
- Middle (A, B and C): only 5 is in all three sets, so write 5 in the middle.
- A and B only: 4 is in A and B but not in C.
- B and C only: 7 is in B and C but not in A.
- A and C only: no number is in A and C without also being in B, so this part is empty.
- One circle only: A only is {1, 2, 3}, B only is {6} and C only is {8, 9}.
- Check: every element of A, B and C appears exactly once in the diagram.
Middle {5}, A and B only {4}, B and C only {7}, A and C only { }, A only {1, 2, 3}, B only {6}, C only {8, 9}.
In the worked example, how many elements are in both A and B?
Show answer
2. A and B only has 1 element (4), and the middle has 1 element (5), so 1 + 1 = 2.
Summary
- A 3 circle Venn diagram uses three overlapping circles to show how three sets are related.
- It has 7 parts inside the circles: 3 one-circle parts, 3 two-circle overlaps and the middle.
- A two-circle overlap shows elements in those two sets but not the third.
- The middle shows elements in all three sets.
- Elements in A and B = elements in A and B only plus elements in A, B, and C.
- To fill in a diagram, start in the middle and put each element in exactly one part.
Test Yourself: 10-Question Quiz
Now check what you learned. Every answer is explained, and each time you play you get new questions.
Quiz complete!